Visualization: VisIt
From: https://wci.llnl.gov/simulation/computer-codes/visit
VisIt is an Open Source, interactive, scalable, visualization, animation and analysis tool. From Unix, Windows or Mac workstations, users can interactively visualize and analyze data ranging in scale from small (<101 core) desktop-sized projects to large (>105 core) leadership-class computing facility simulation campaigns. Users can quickly generate visualizations, animate them through time, manipulate them with a variety of operators and mathematical expressions, and save the resulting images and animations for presentations. VisIt contains a rich set of visualization features to enable users to view a wide variety of data including scalar and vector fields defined on two- and three-dimensional (2D and 3D) structured, adaptive and unstructured meshes. Owing to its customizeable plugin design, VisIt is capabable of visualizing data from over 120 different scientific data formats (see this partial list).
Introduction
VisIt is available on Spruce Knob in a client server model. In order to utilize Visit, you will need to install a local (client) copy of VisIt on your workstation/laptop. This will allow you to visualize your data on your workstation but but be able to run VisIt against data stored in Spruce Knob filesystems. For any back-end processing that VisIt might need, it can also take advantage of Spruce Knob’s processing power.
Client Installation
By the time this wikipage was reviewed (July 19, 2017) the latest version available was 2.12.3 released on June, 2017. Client executables are available from 1. Be sure to read the install notes for your particular installation need. In most cases you will use the 64 bit version appropriated for your OS (Windows, Mac or Linux)
Note: You will need to download a version that matches an available version on Spruce Knob. Currently we have 2.12.2 released on April 2017. If both client and server are 2.12.x they should work correctly
Running VisIt in the Client/Server Model
After successfully installing VisIt on your workstation, you can run through the following steps to start using it on in connection with Spruce Knob. Note: The following setups up VisIt to run in Parallel Mode but the same instructions apply for a serial run. When you enter the number of processors you need during the submission process, just select 1.
Configuring Client to use Spruce Knob as a Server
Execute ‘visit’:
You can just use the icon or the command line. The command line is useful to identify problems during the first configuration of Visit to use Spruce as server. On MacOS the command line is accesible with:
`` /Applications/VisIt.app/Contents/Resources/bin/visit``
Go-to Options menu and select Host Profiles ….
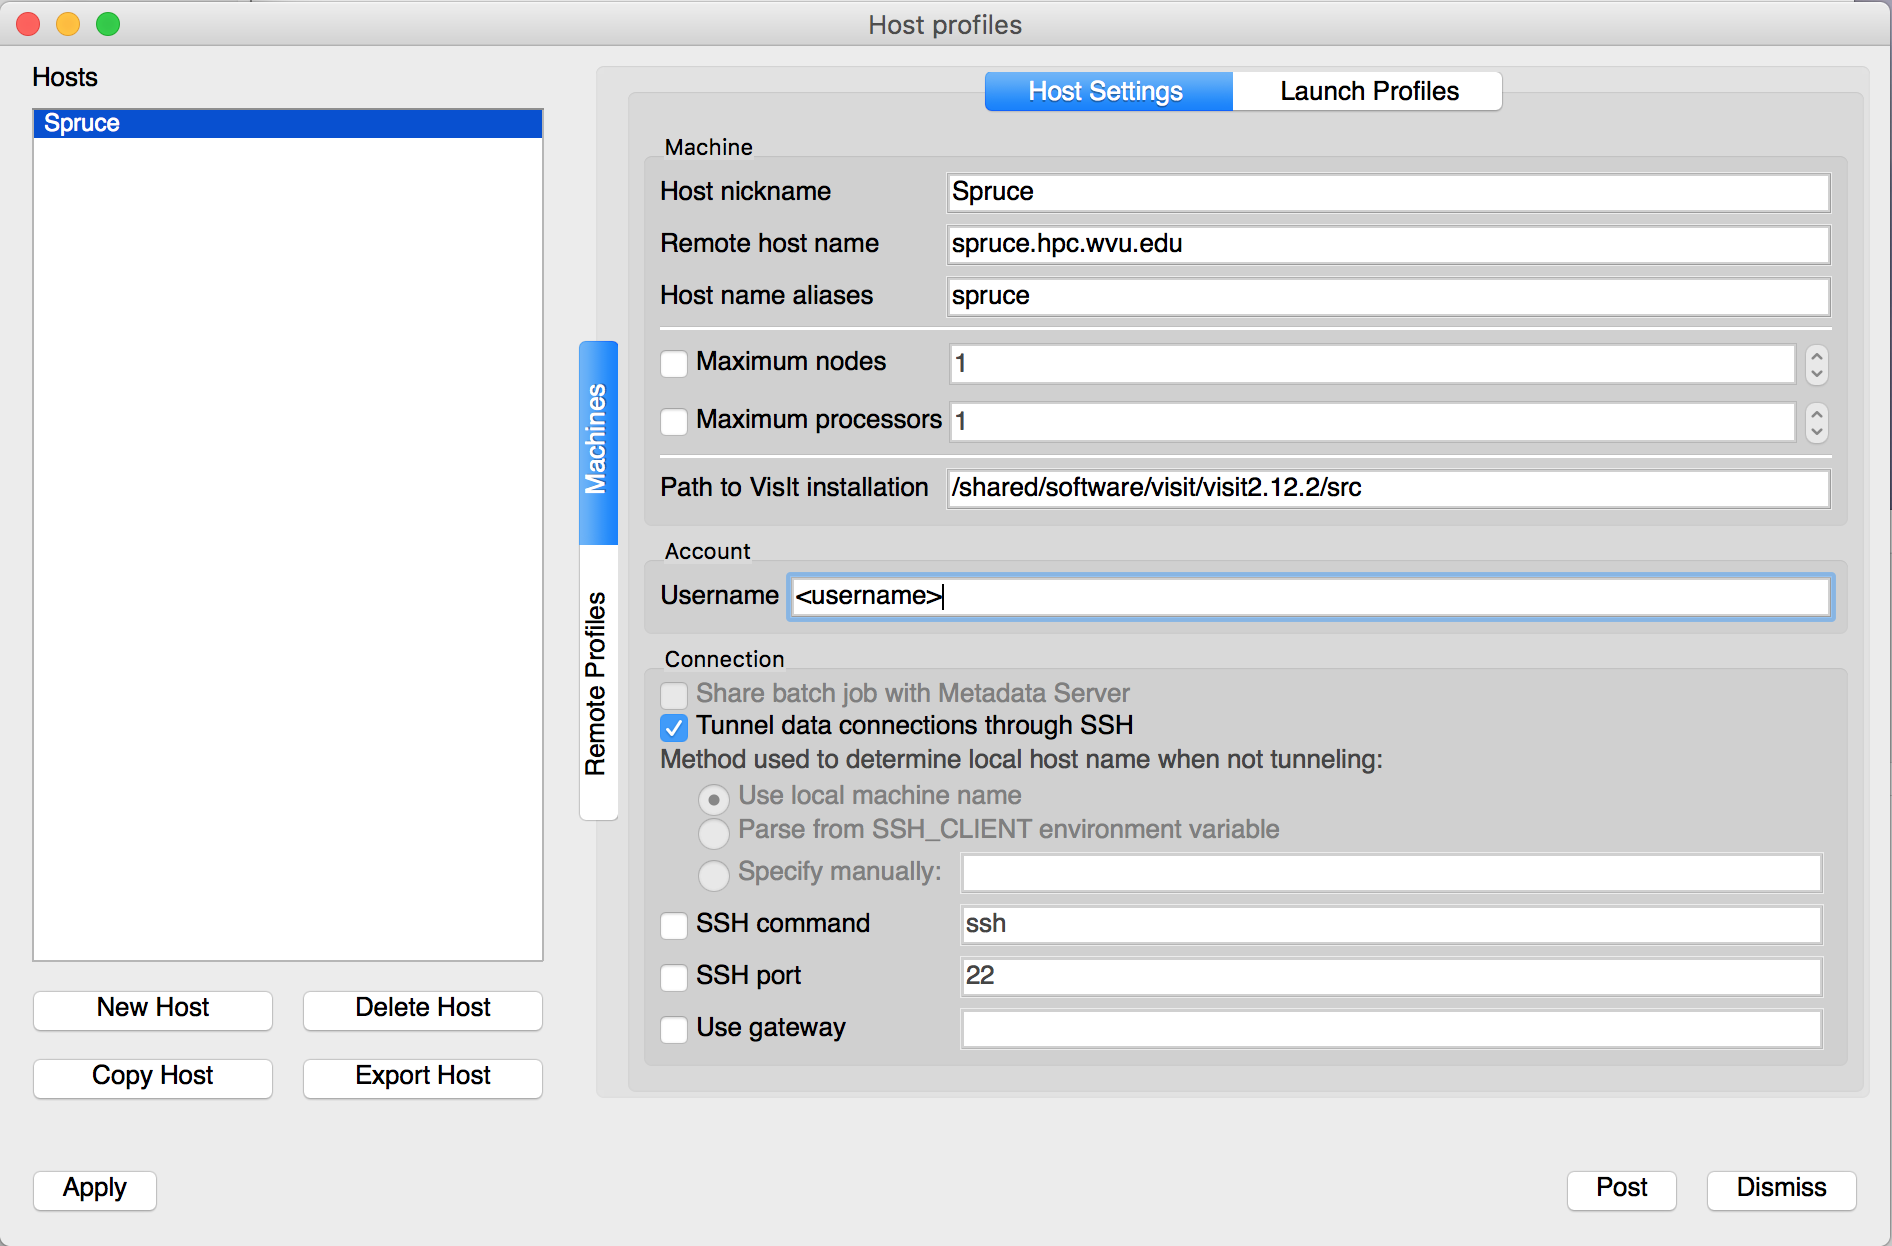
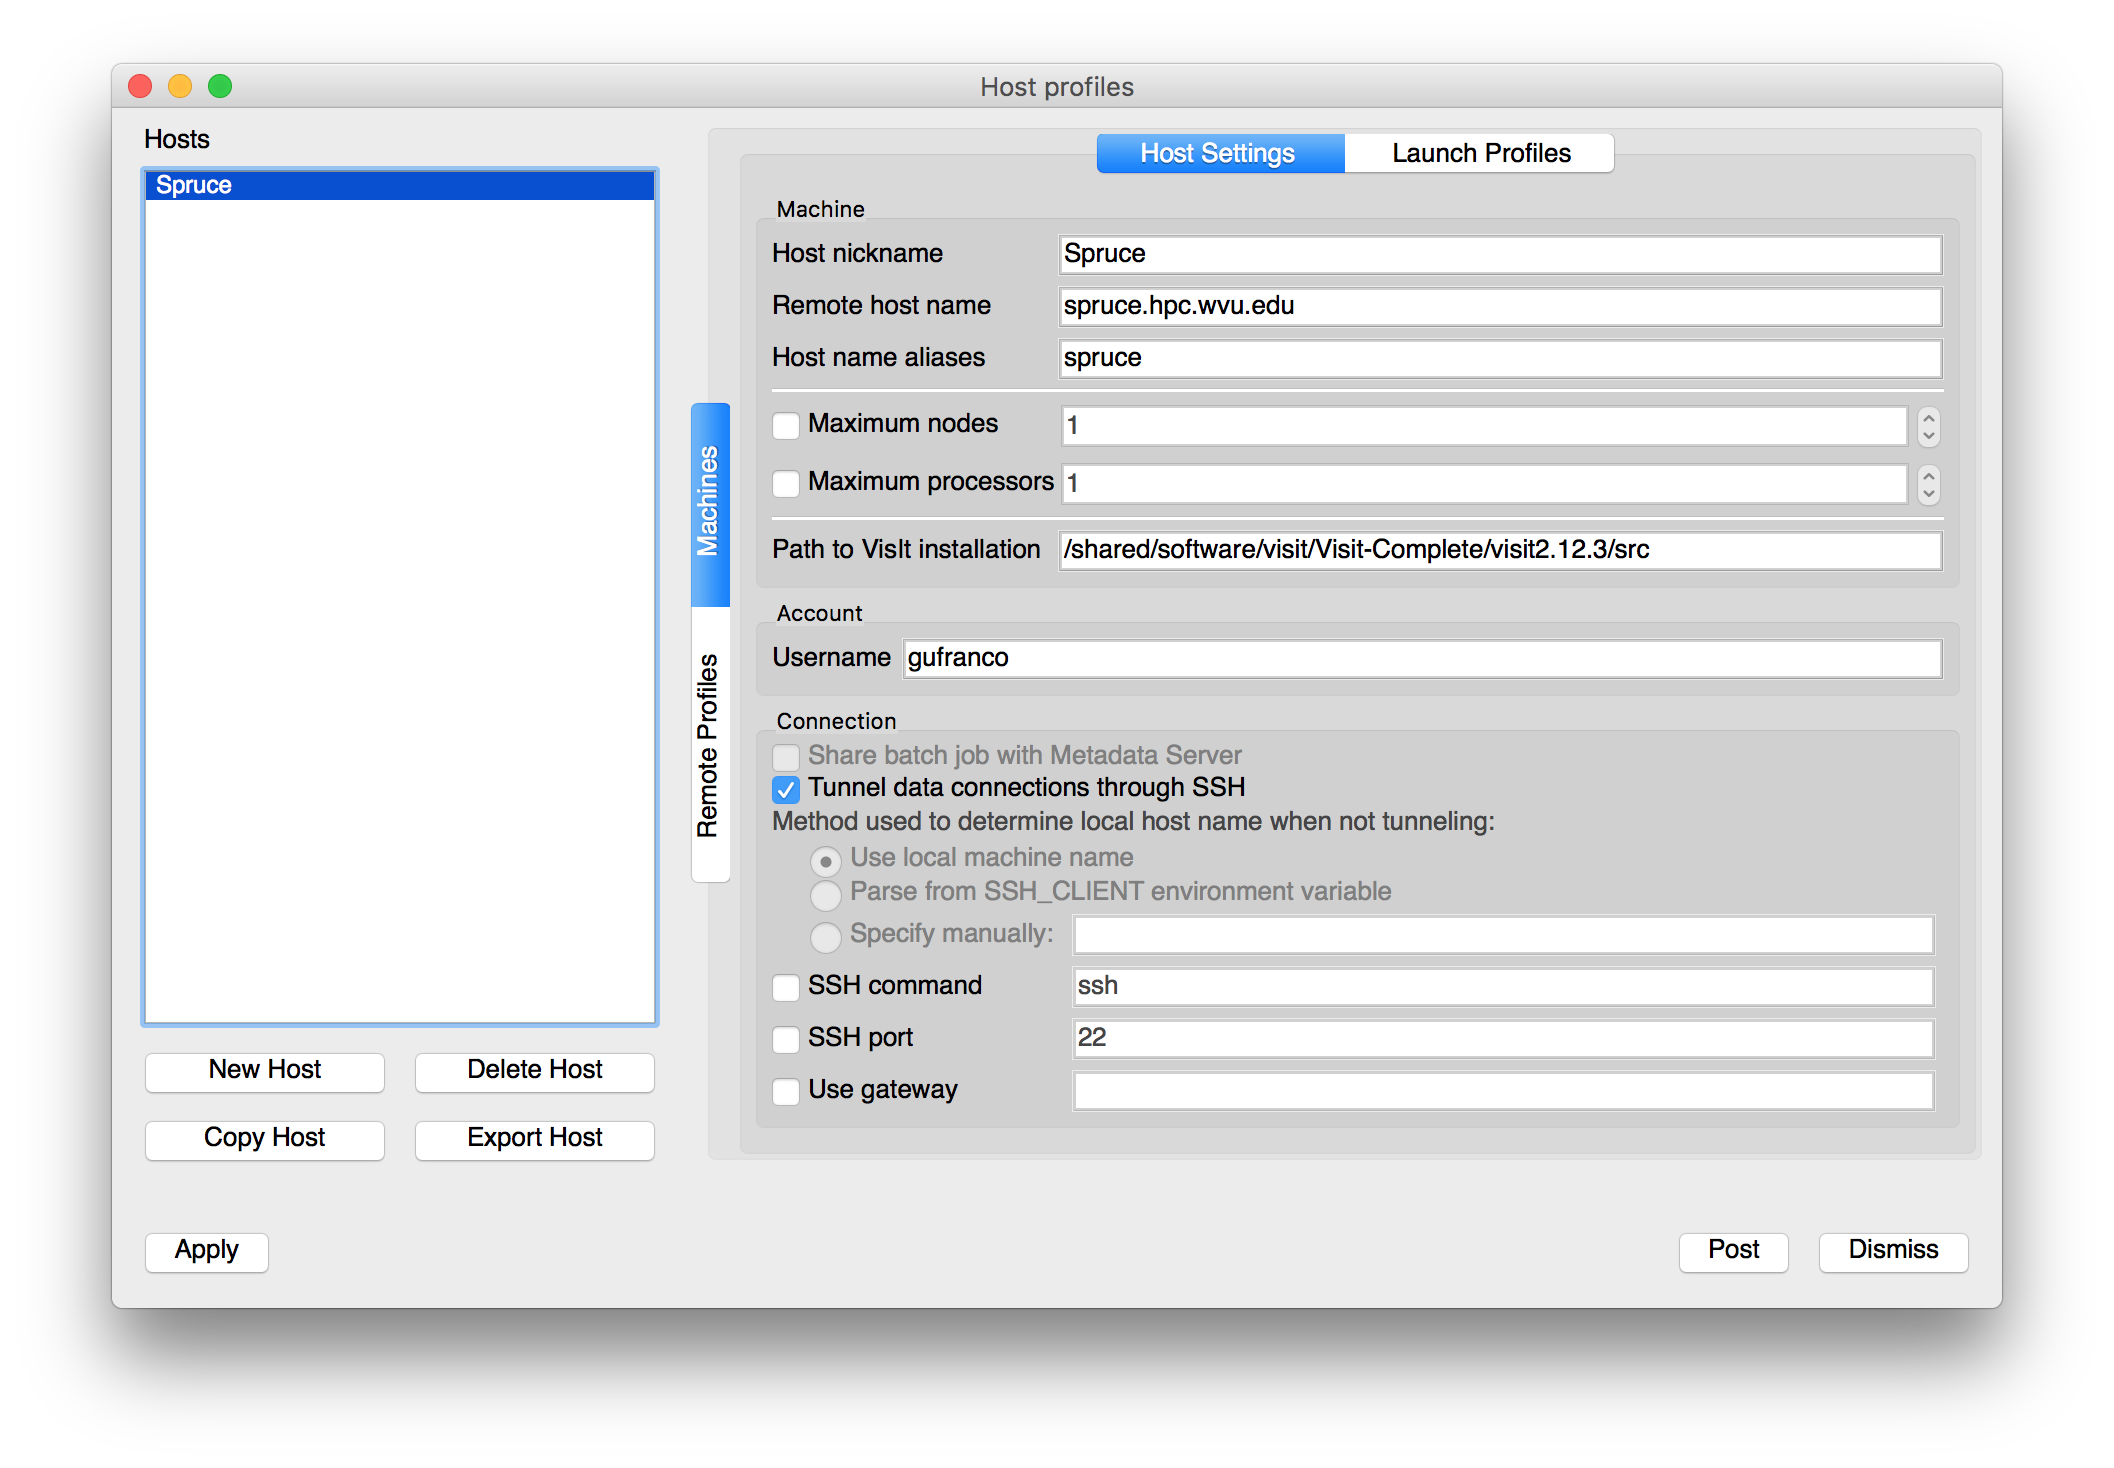
In the Host profiles window, select New and enter the following information on the Host Settings tab.
host_settings_1.png
host_settings_2.png
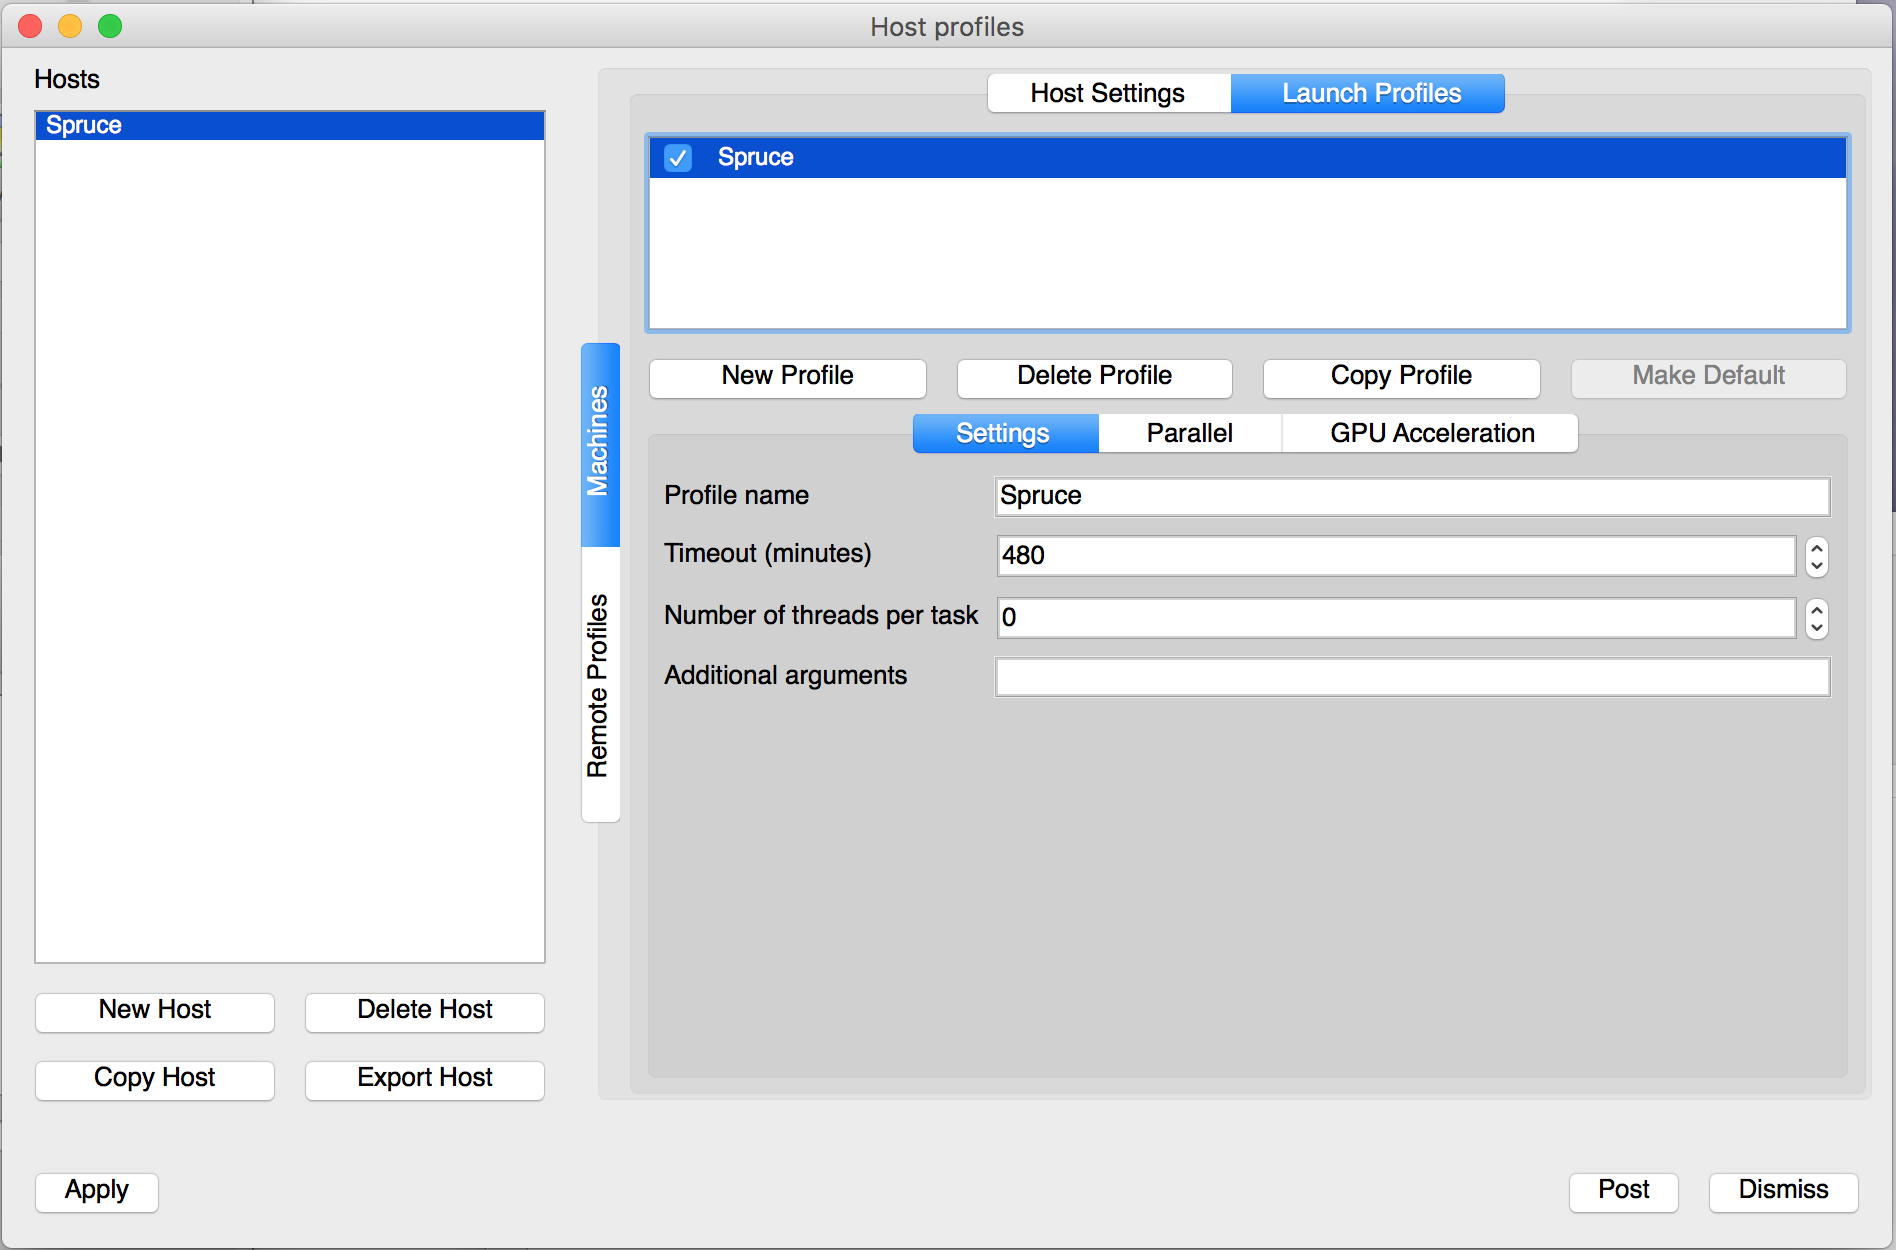
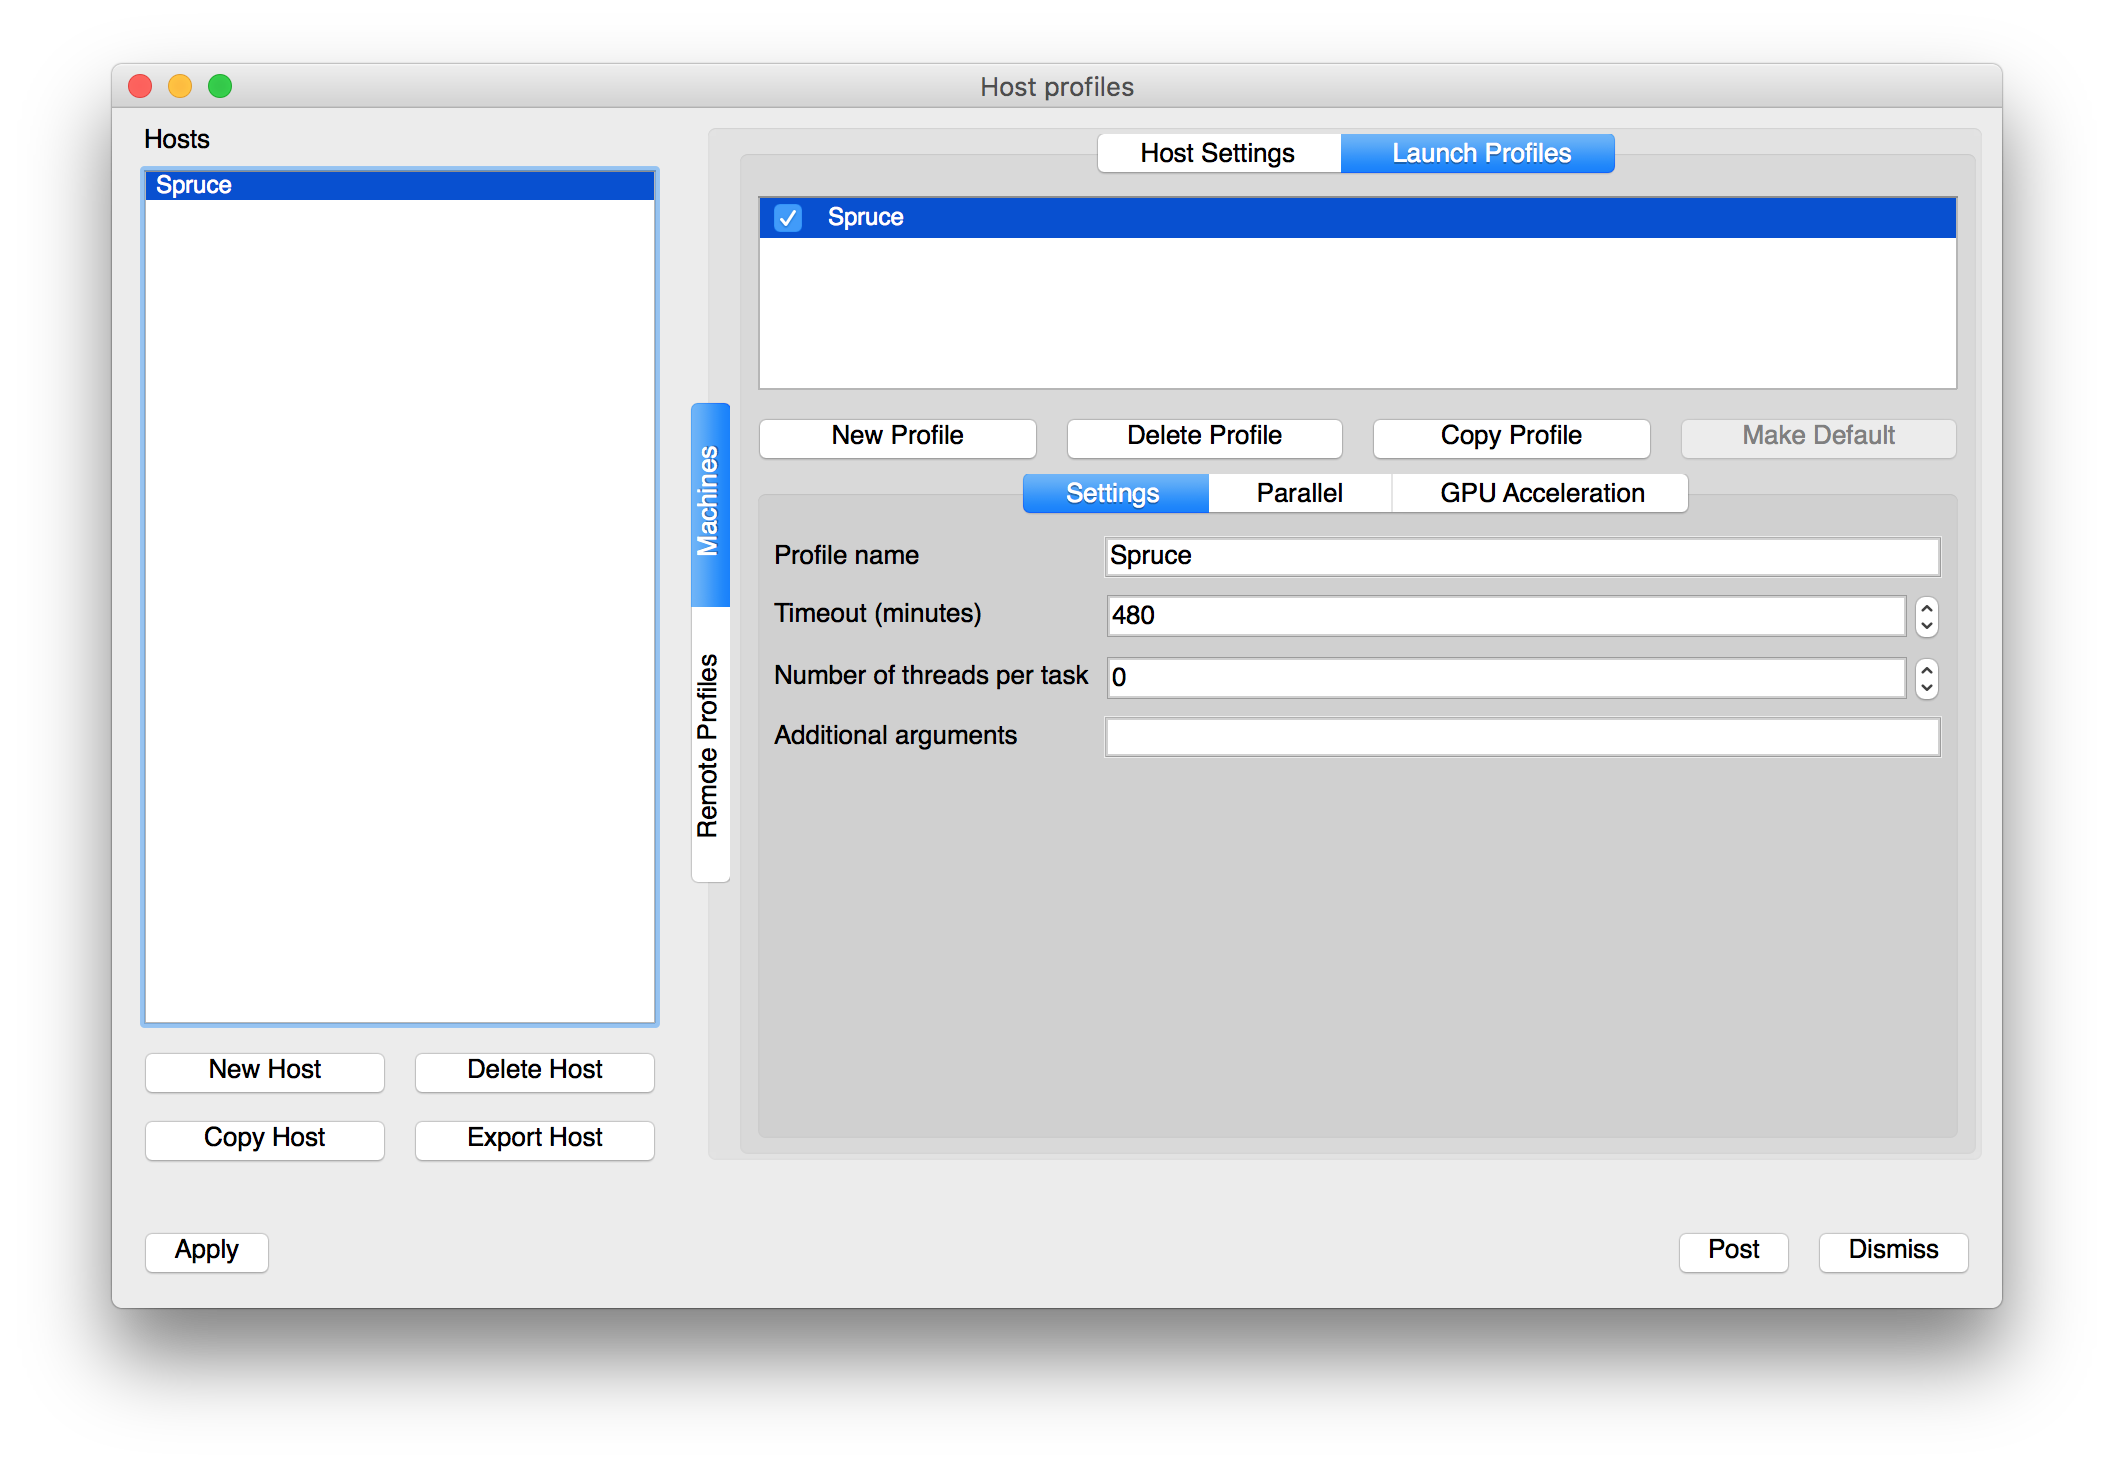
Select the Launch Profile tab and select New Profile and enter the following information in the Settings sub tab.
launch_profiles_1.png
launch_profiles_2.png
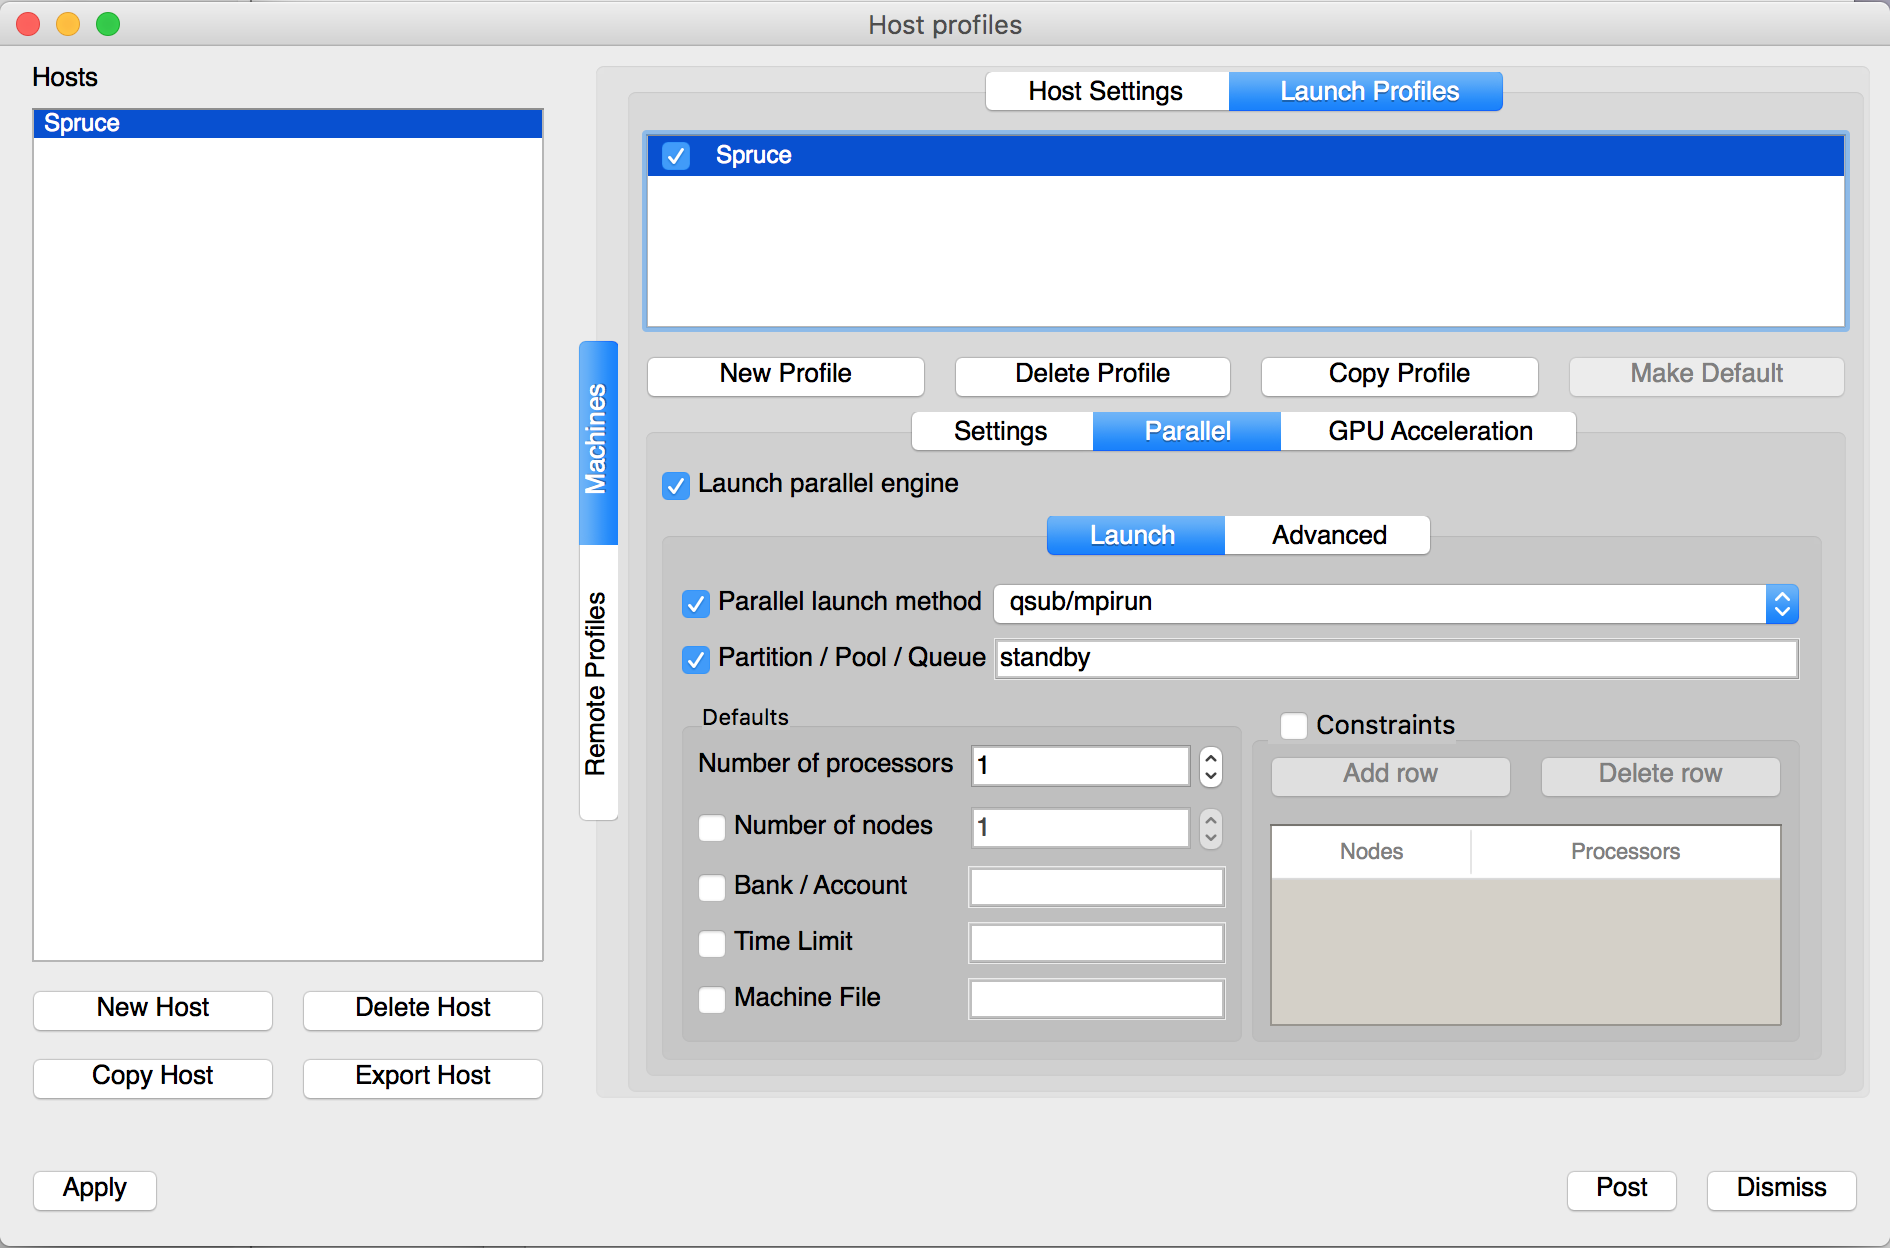
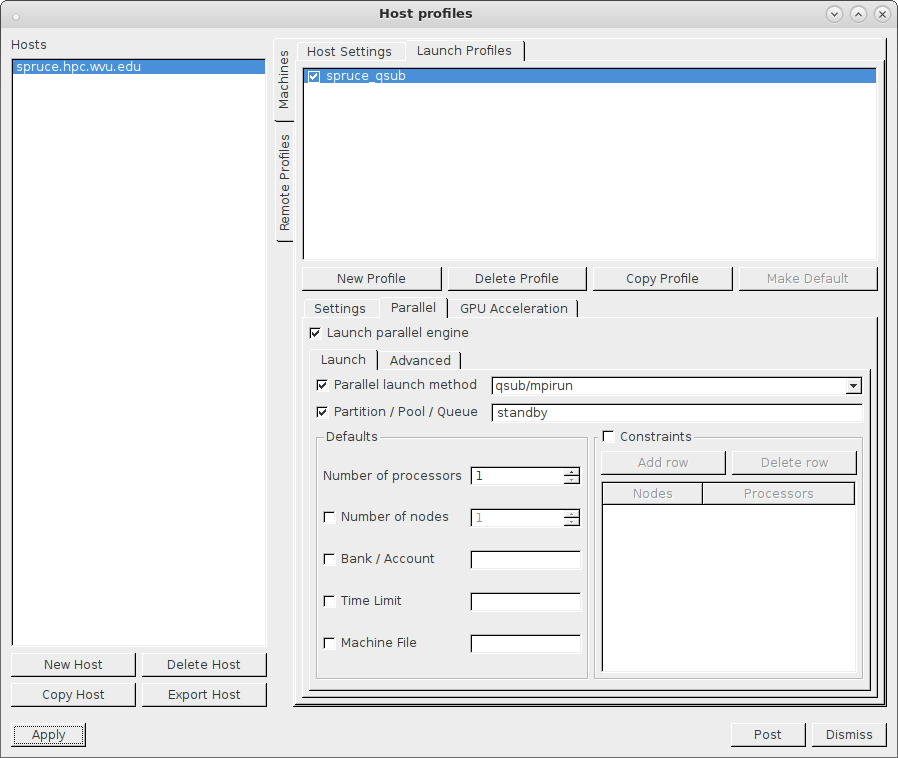
Select the Parallel sub tab and enter the following information. Note, you can use a different Queue setting but in most cases standby should be sufficient unless you suspect your task will last longer than 4 hours.
parallel_options_1.png
parallel_options_2.png
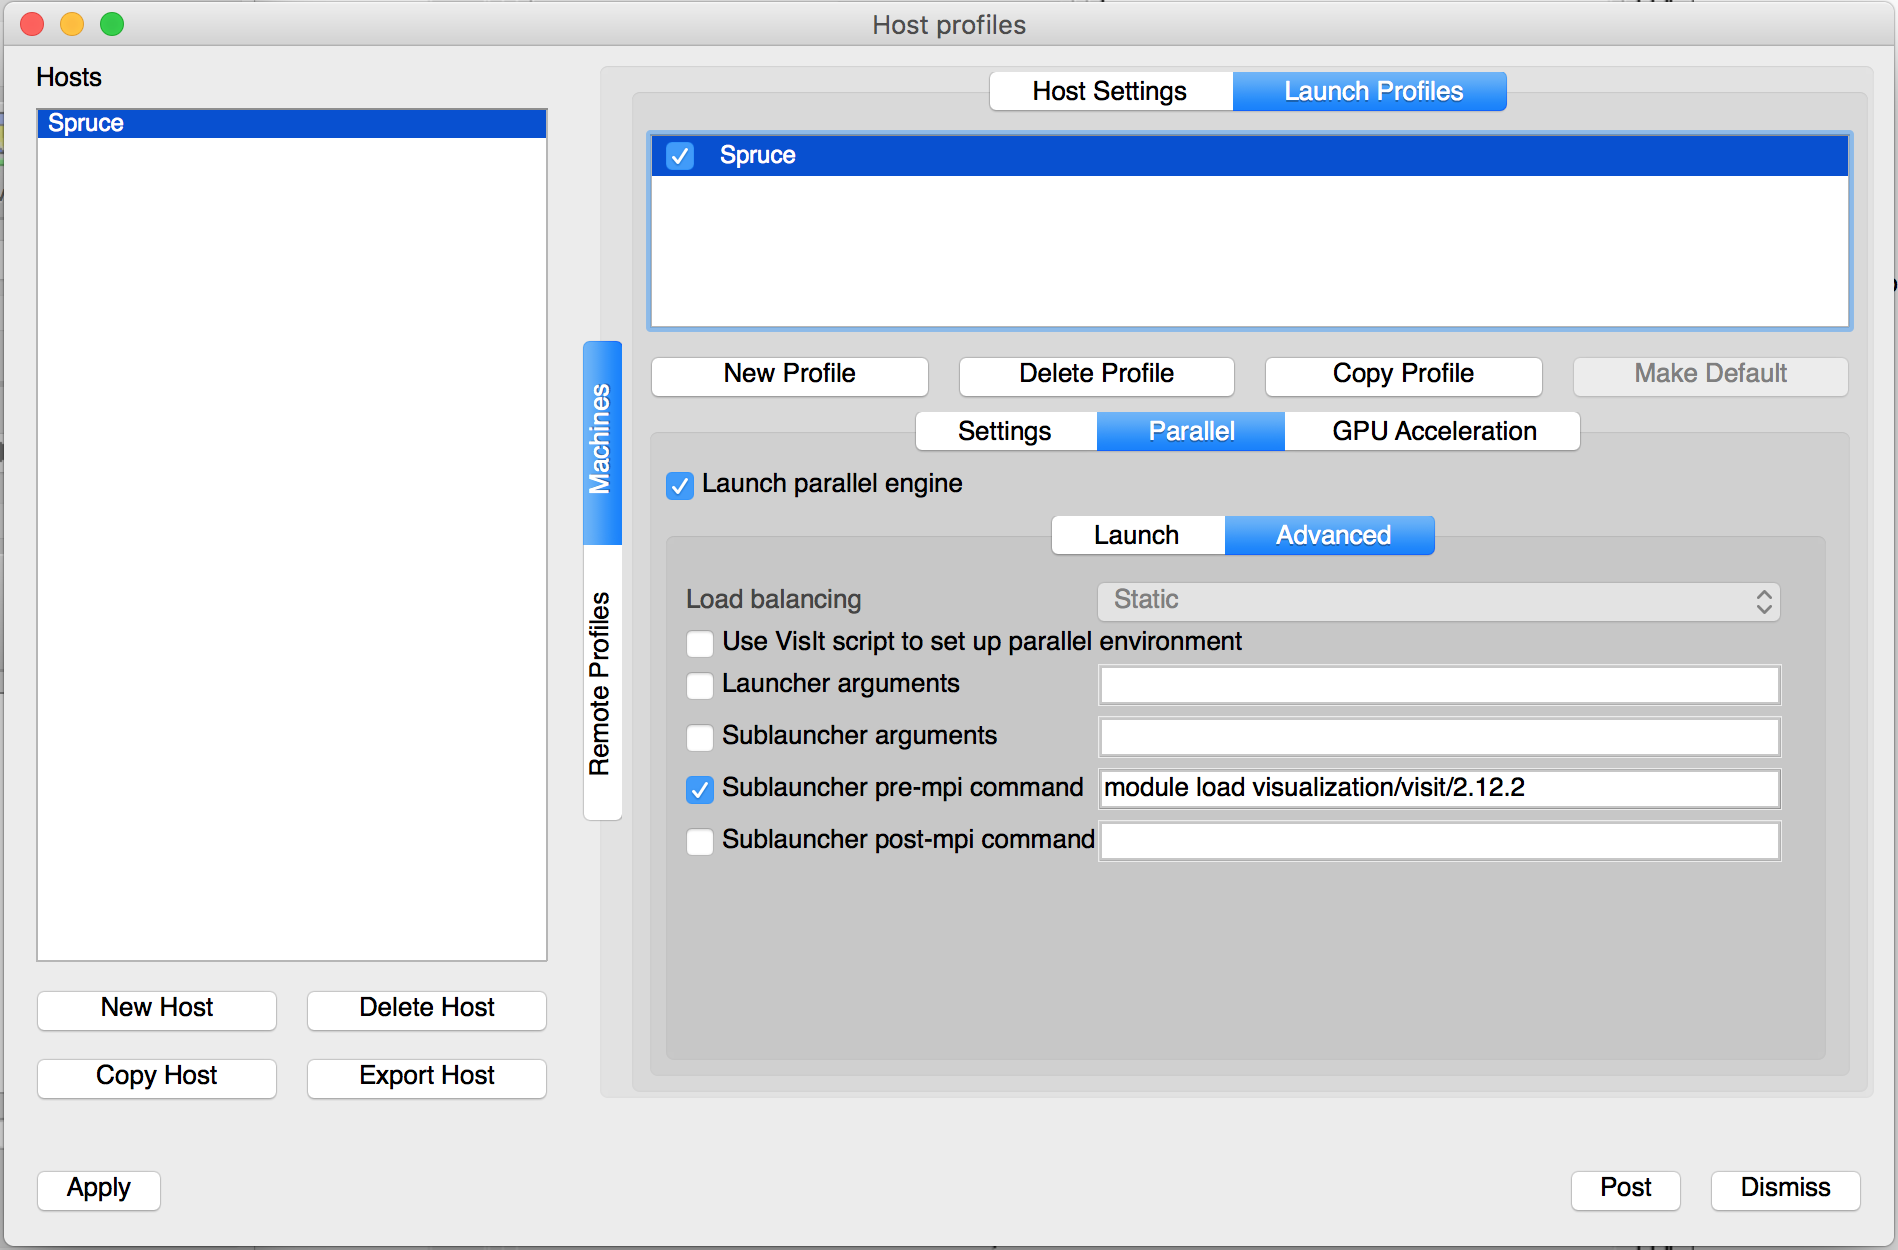
Within the Parallel sub tab, select the Advanced sub tab, and enter module load visualization/visit/2.10.2 in the Sublauncher pre-mpi command field. Screen should look as follows:
parallel_advanced.png
Select Apply in the lower left corner.
Select Options and Save Settings from the menu on the main VisIt user interface.
Connect your client to Spruce Knob
If VisIt is not already running on your workstation, start it by executing visit on the command line.
Select Open under the Sources section.
Select spruce.hpc.wvu.edu in the Host Section and enter your password when prompt. You should see screen similar to the following.

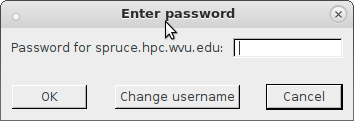
You should now see the contents of your home directory and ready to use VisIt on your local data.
Visualize an Example VisIt Dataset
Note: This assumes you have already connected to Spruce Knob from your client workstation following the instructions from the previous section.
Change Path to /shared/software/visit/latest/data and select globe.silo.
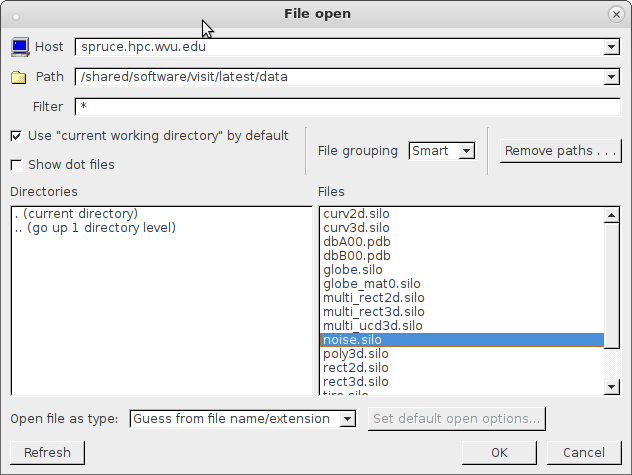
example_data.png
If necessary, change the options for job submission and select OK.
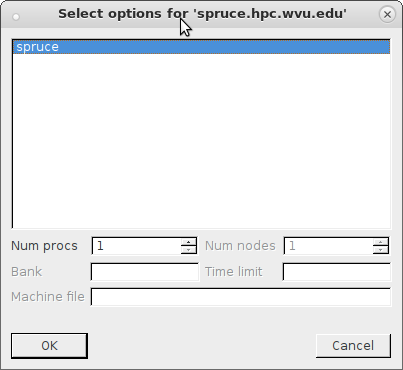
select_options.png
The following dialog box will appear until a spot is open on the cluster for your job to run. When using the standby queue, this should be less than 60 seconds assuming the cluster is not completely busy.
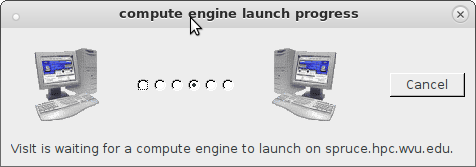
compute_engine.png
In Plots select Pseudocolor and disp_magnitude.
Select Draw and you should see an output similar to the following.
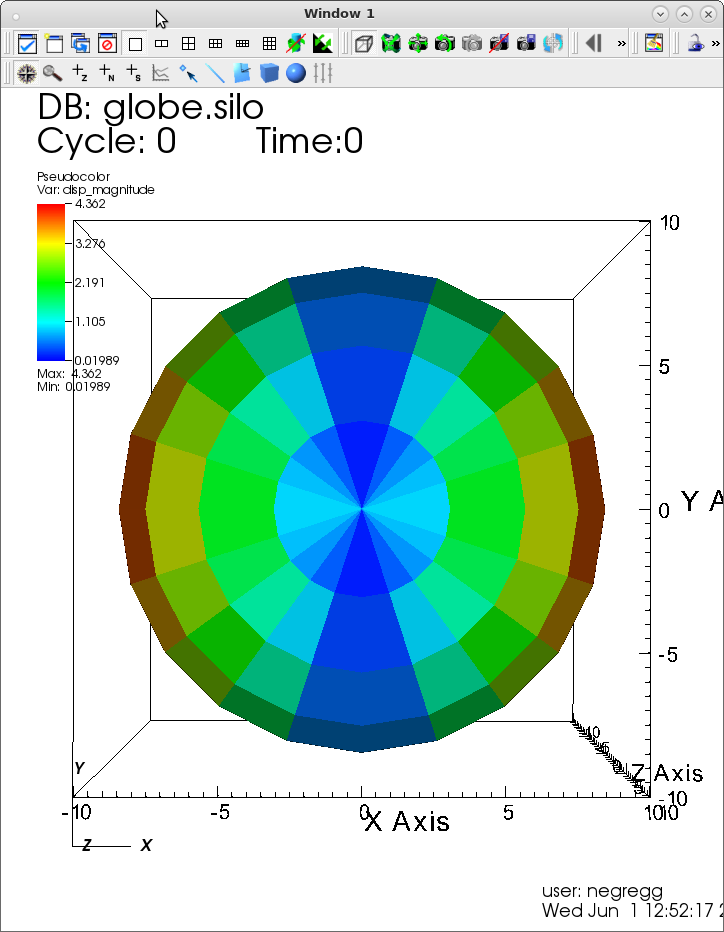
visit_output.png